This is the final post of the “Getting Started with Investing” series. So far, it covered why investing now is incredibly important, some investing basics to know, how to choose a brokerage, finding investing ideas, and learning the fundamentals of valuation (Part 1 and Part 2). Now, we are going to finish up with knowing when to sell your beloved stocks when the time comes, regardless of whether they have gone up or down.
–
Investing is tough. You can spend hours researching specific companies, reading their annual reports, reading all the news and blogs that you can on them, and be totally convinced that they are a great company. The company could then even double in value in a year’s time (or more than triple, in the case of MCP!), and make you incredibly happy. This positive upward movement could last for several years, consistently (see AAPL). But perhaps the biggest challenge facing investors is the question of when it is appropriate to sell.
Enter the Value Investing Approach.
I subscribe heavily to the value investing school of thought. According to it, you buy a company that you find is undervalued and sell short a company that is overvalued. In order to protect your downside, you ensure that there is a sufficient margin of safety. You revisit the investment periodically to gauge if anything fundamental has changed with the company. If so, you revise your analysis and sell if necessary.
This brings us to the important concept of a target price. If you ever read news on CNBC or any of the major financial networks, you will hear this term thrown around quite a bit. The context is usually when an analyst at a big institution (e.g. Raymond James or Credit Suisse) upgrades or downgrades a stock. When they upgrade a stock, for instance, from neutral to overweight, they will sometimes set a target price. Despite there usually being inherent conflicts of interest, these analyst recommendations have a disproportionate effect of the movement of the stock.
Let’s look at an example: Oppenheimer (NYSE: OPY) Analysts Raise Price Target on Dominion Resources, Inc. (NYSE: D) Shares to $46.00. This was just written on January 15th, 2011 (same day as this writing). Even by just reading the title, we can see that Oppenheimer, a big institutional bank and broker, raised its target price on Dominion, a big energy producer, to $46.00.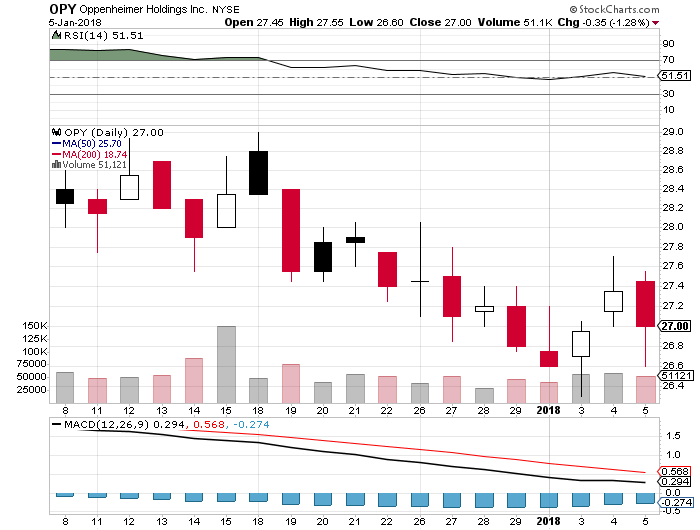
Now, as I mentioned, this is a very commonplace practice. Big banks love to boost up their target prices for companies for a number of reasons. In the end, it really comes down to helping them make more money. I won’t get deep into the mechanics of why Wall Street is fraught with conflicts of interest, as there are many other good books that do justice to this (off the top of my head, Seth Klarman’s Margin of Safety is a great read on the subject, except for the fact that it is out of print and incredibly expensive). A short list of reasons is as follows: banks encourage trading in the stocks that they promote, thus earning their trading divisions commissions, regardless of whether the stock goes up or down; if banks have a relationship with the company such as underwriting its debt or stock offerings, than this helps the company raise more money, of which the bank can take a cut; finally, banks might have positions in the company they promote, which will increase in value if the stock increases.
Now, despite these three conflicts of interest that I mentioned off the top of my head, investors still use these price targets as part of their “homework” when they buy a stock, regardless of how arbitrary the price is. In the article I linked above, the price target is notably unambitious. Dominion (D) closed the day before this was written at $42.98. A price target of $44.00 represents a massive 2.4% increase on the stock, and the revised price target of $46.00 is a whopping 7% increase. Who wouldn’t want to buy this big winner? In fact, the 52 week range of the stock was from around $36 to $45.12. Therefore, the analyst at Oppenheimer really has no risk of being wrong, as the stock will likely touch its target price because of natural fluctuations in the market.
This is where we come in. Despite how bad I’ve made target prices sound, there is actually a lot of value in them for investors like you and me who use them appropriately. In the previous two posts, I covered how to walk through a basic discounted cash flow analysis. The goal of the DCF is to end up with a target price (or range of prices) at which you’d be willing to buy this company. As I mentioned before, we want to have a margin of safety for the company, so even if our estimates are way off in the DCF model, we will still stand a good chance of making a profit.
Since a DCF model (i.e. absolute valuation) is still quite complex to walk through completely, I’ll show you how to figure out a target price using relative valuation. With relative valuation, we attempt to figure out if a company is undervalued or overvalued relative to its competitors. However, we can get specific if we use certain metrics. One I’ve talked about in the past is the price-to-earnings ratio. This is the ratio of the current stock price divided by the earnings per share of the company. If we know the price-to-earnings for a company as well as its competitors, we could compare them.
Let’s use Goldman Sachs (GS) as an example:
It has a price-to-earnings of just under 10. Its competitors have P/E ratios in a similar range, but on average, they are slightly higher. If we take an average P/E for the group, then we can multiply this by GS’s EPS to arrive at an implied price. I put together this spreadsheet quickly to show what I mean:
All else equal, using the implied P/E of its competitors, GS could roughly trade for a price of $333.50 and not be expensive relative to its peers. This represents a premium of more than 90% on the closing price of $175.00 at the time of writing. But something I noticed in the list of competitors was that Nomura, a Japanese financial institution, had a P/E of 61.55. This seems a bit anomalous, so even if we remove that data point from the average, GS still has an implied price of $240.23 (a premium of 37%). Both of those numbers seem attractive to me.
Closing thoughts
The method I just outlined is probably the easiest way to figure out a target price for your stock. What happens if or when the company hits your target price? Usually at that point, you should either sell or revisit your investment thesis. If you are still comfortable owning it, it makes sense to recompute your target price using the same formula as before (Company EPS times competitors’ average P/E ratio). If your company still seems relatively undervalued, then you will probably want to continue holding onto it!
##
As I mentioned, this post concludes the Getting Started with Investing series. Now that this is complete, we can move on to more varied topics. Among some of the ideas I have lined up are explanations of common metrics (to be called ‘Metric of the Week’), reviews of brokerages, more book reviews, and helpful things related to 20 and 30 year old personal finance and investing. If you would like to see a topic covered, please leave a note in the comments! As always, I appreciate any feedback that you might have.
Follow me on Twitter, or subscribe to the RSS feed if you don’t already! Thanks!