Overview–What is relative valuation?
Relative valuation is a process that most investors go through when analyzing an opportunity. If you want to value a stock, you can approach it relatively or absolutely. A common form of absolute valuation is the discounted cash flow analysis (but we’ll save that for another post). With relative valuation, there are different methods, but the one we’ll go through today is based on common valuation metrics. These are ratios and measurements that a lot of people have heard of at least once, such as P/E, EPS, and Market cap. All of these metrics are easily available for publicly traded companies, so it is much easier than other methods (DCF, comparable transactions et al.) where you must track down hard-to-find information.
But first, a few definitions
Most common ratios are based on the price per share of a stock, and so change dynamically as the stock price does. However, we don’t need to worry about the exact ratio at any point in time, since relative valuation is an imperfect science. Let’s see what a few of the most common relative valuation metrics are:
Price to earnings ratio (P/E): The price per share divided by the total net income (bottom line) for that year or quarter.
Price to sales ratio (P/S): The price per share divided by the total revenue (top line) for that year or quarter.
Price to book ratio (P/B): The price per share divided by the total net assets of the company (net assets = the value of a company’s assets minus the value of its debt)
Earnings per share (EPS): This is a simply ratio of the total earnings available to common shareholders divided by the number of shares outstanding.
Market capitalization: This is the total market value of all of a company’s stock. It is simply the price per share (quote) times the number of shares outstanding.
How to relatively value a stock using Google Finance
In this section, I’ll show you specifically how to relatively value a stock using Google Finance, since it’s a free and extremely easy way to do so. First, go to Google Finance. In the search bar, where you normally enter keywords to search for, enter the name of your favorite company (don’t worry, I won’t judge you if Apple comes to mind). Find your company on the list and click on it. The next screen will look like this:
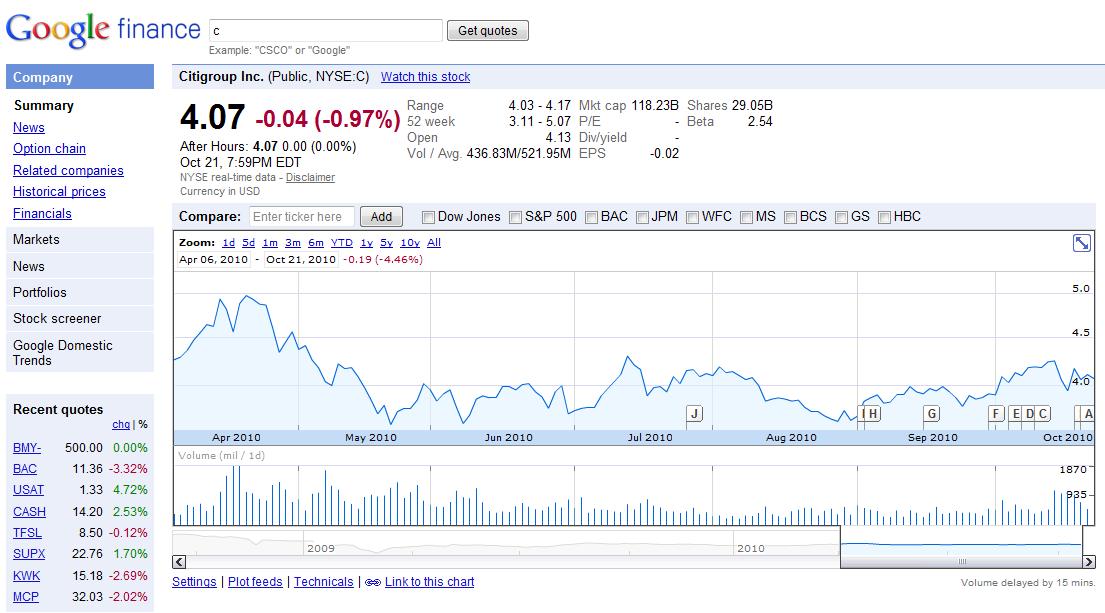
The above page shows the user interface and chart for Citigroup (C). The top portion below the search bar includes all the basic metrics mentioned above, so you can always see them at a glance when you search a company. Right below that shows you the section of the comparables (comparable metrics) between Citi and its main competitors.
If you click on the Add or Remove Columns button, it will pull up a list. You can then check the boxes on the different metrics you can measure. When you are finished selecting the metrics, press “Save Changes.”
While some of these metrics may not make sense now, suffice it to say that they all measure the financial health of a company. At a very basic level, one of the rules of value investing is that you want to buy a company that earns a solid profit, since a company that loses money over the long run is unsustainable. If you see a lot of negative signs in front of the EPS, the P/E, or any of the other basic metrics, this might be a warning sign to tread carefully. In the example above, Citigroup does not show a P/E ratio because it has lost a great deal of money over the past year. As a result, it might not be the best candidate to use relative valuation on.
Analysis–What does any of this mean, and how is it helpful?
Relative valuation is helpful when analyzing companies because it gives a relative price with respect to key metrics compared to other similar companies. Take for example, two big banks: Bank of America (BAC) and Citigroup (C). Both are in the same industry (financial services) and are both large companies. As they make money in pretty much the same way, it seems fair to say that comparing them relatively is justifiable. The share price for each company should presumably be about the same when measured against their sales or earnings. If you can buy BAC for a price-to-sales of 5.00, then buying C for a price/sales of 6 or 7 makes it seem expensive.
Relative valuation can give an indication of a company being overpriced in a specific industry. Back in the dot-com bubble of the late 1990s, some new internet companies traded at price-to-earnings of more than 100. Today, any company trading at that high of a P/E is considered speculative, since it clearly does not have the earnings to support its price. As a general rule, growth stocks (companies that are relatively younger and growing quickly, e.g. Google, Apple) tend to have higher price-to-earnings than do value stocks (companies that are more established and have stable earnings, e.g. Merck, General Electric). That doesn’t necessarily mean that one is better than the other, but only that they should be approached differently when considered as an investment. Relative valuation works best when all the companies under consideration are in the same line of business, and are all either growth stocks or value stocks.
A few caveats
Like any investing tool, relative valuation has its limitations and should only be used in conjunction with other tools in order to arrive at a conclusion for an opportunity. There are always many factors affecting a company’s share price, so it is not always actionable if you find out one company is overpriced according to its P/E measure. I’ll make a post in the future detailing all the various reasons why a stock price might move, so stay tuned for that! [edit: see here]